The explosive growth of online retail has created an equally significant challenge: managing product returns efficiently. Reverse logistics e commerce represents the comprehensive process of moving goods from customers back through the supply chain, encompassing returns management, product inspection, refurbishment, restocking, and disposal. As e-commerce brands scale their operations in 2026, understanding and optimizing reverse logistics has become essential for maintaining profitability while delivering exceptional customer experiences. Fast-growing brands must now balance customer-friendly return policies with operational efficiency and sustainability goals.
Understanding Reverse Logistics in the E-Commerce Ecosystem
Reverse logistics e commerce differs fundamentally from traditional forward logistics. While standard fulfillment focuses on moving products from warehouses to customers, reverse logistics manages the opposite flow. This process includes receiving returned items, evaluating their condition, determining disposition, and either restocking inventory, refurbishing products, or responsibly disposing of unsalvageable items.
The complexity increases exponentially when managing returns across multiple sales channels. Amazon FBA sellers, direct-to-consumer brands, and marketplace merchants each face unique reverse logistics challenges. Research from Deloitte highlights the surge in e-commerce returns and the critical need for robust strategies to maintain inventory efficiency.
Key Components of Effective Reverse Logistics
- Returns authorization and tracking systems
- Product inspection and quality control protocols
- Inventory disposition decision frameworks
- Refurbishment and repackaging operations
- Data analytics for identifying return patterns
These components work together to create a seamless reverse flow that minimizes costs while maximizing recovered value. Successful operations integrate technology platforms that automate authorization, track returned products in real-time, and provide visibility across the entire reverse supply chain.

Financial Impact and Operational Considerations
Return rates in e-commerce typically range between 20-30% across most product categories, with apparel and electronics experiencing even higher percentages. This volume represents billions in lost revenue and operational costs annually. Understanding the financial implications drives strategic decision-making around returns policies and infrastructure investments.
Direct costs include shipping expenses, labor for processing returns, warehouse space allocation, and inventory write-downs. Indirect costs encompass customer acquisition expenses for replacement orders, decreased inventory turnover, and potential brand damage from poor returns experiences. Smart brands recognize that efficient reverse logistics e commerce operations can transform these cost centers into competitive advantages.
Return Cost Analysis by Category
| Product Category | Average Return Rate | Processing Cost per Item | Restocking Percentage |
|---|---|---|---|
| Apparel | 25-30% | $8-12 | 65-70% |
| Electronics | 15-20% | $15-25 | 45-50% |
| Home Goods | 18-22% | $10-18 | 55-60% |
| Beauty Products | 10-15% | $5-8 | 70-75% |
These metrics demonstrate why partnering with specialized reverse logistics solutions providers makes financial sense for growing brands. Professional fulfillment partners bring economies of scale, specialized equipment, and experienced teams that reduce per-unit processing costs significantly.
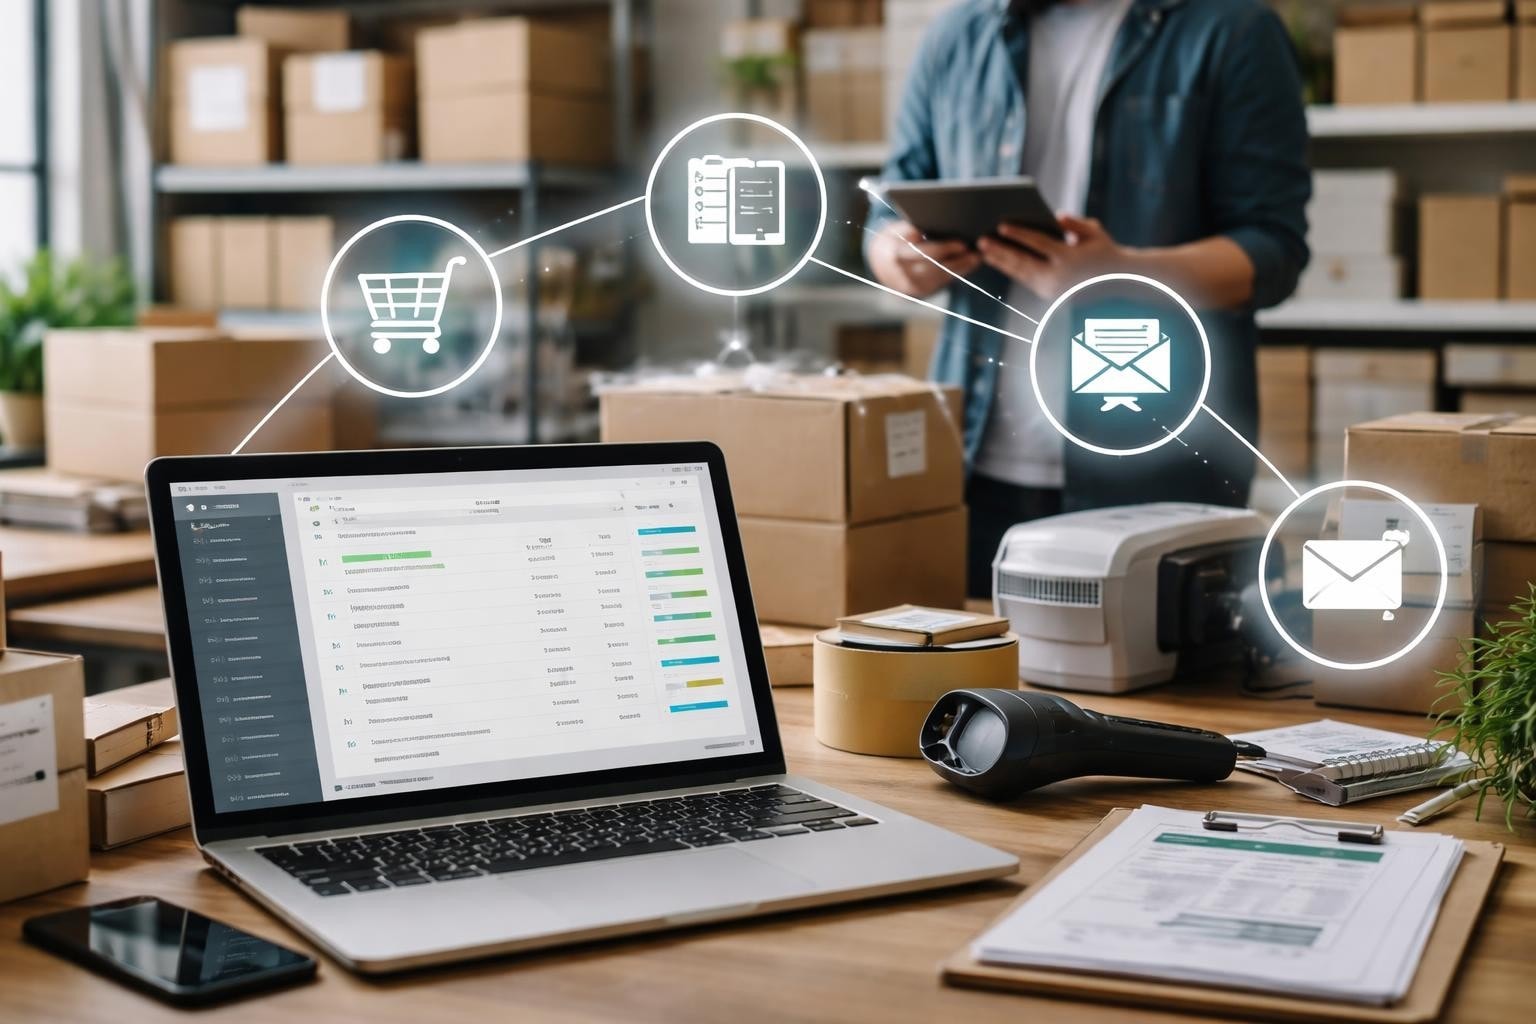
Technology Integration and Automation Strategies
Modern reverse logistics e commerce systems leverage sophisticated technology to streamline operations. Warehouse management systems (WMS) enhanced with reverse logistics modules automate receiving, tracking, and disposition decisions. Integration with e-commerce platforms enables automatic return authorization generation and customer communication.
Advanced operations employ artificial intelligence for predictive analytics. Machine learning algorithms analyze historical return data to identify patterns, predict future return volumes, and even flag potentially fraudulent return activity. This intelligence allows brands to proactively address quality issues, adjust product descriptions, and optimize packaging to reduce return rates.
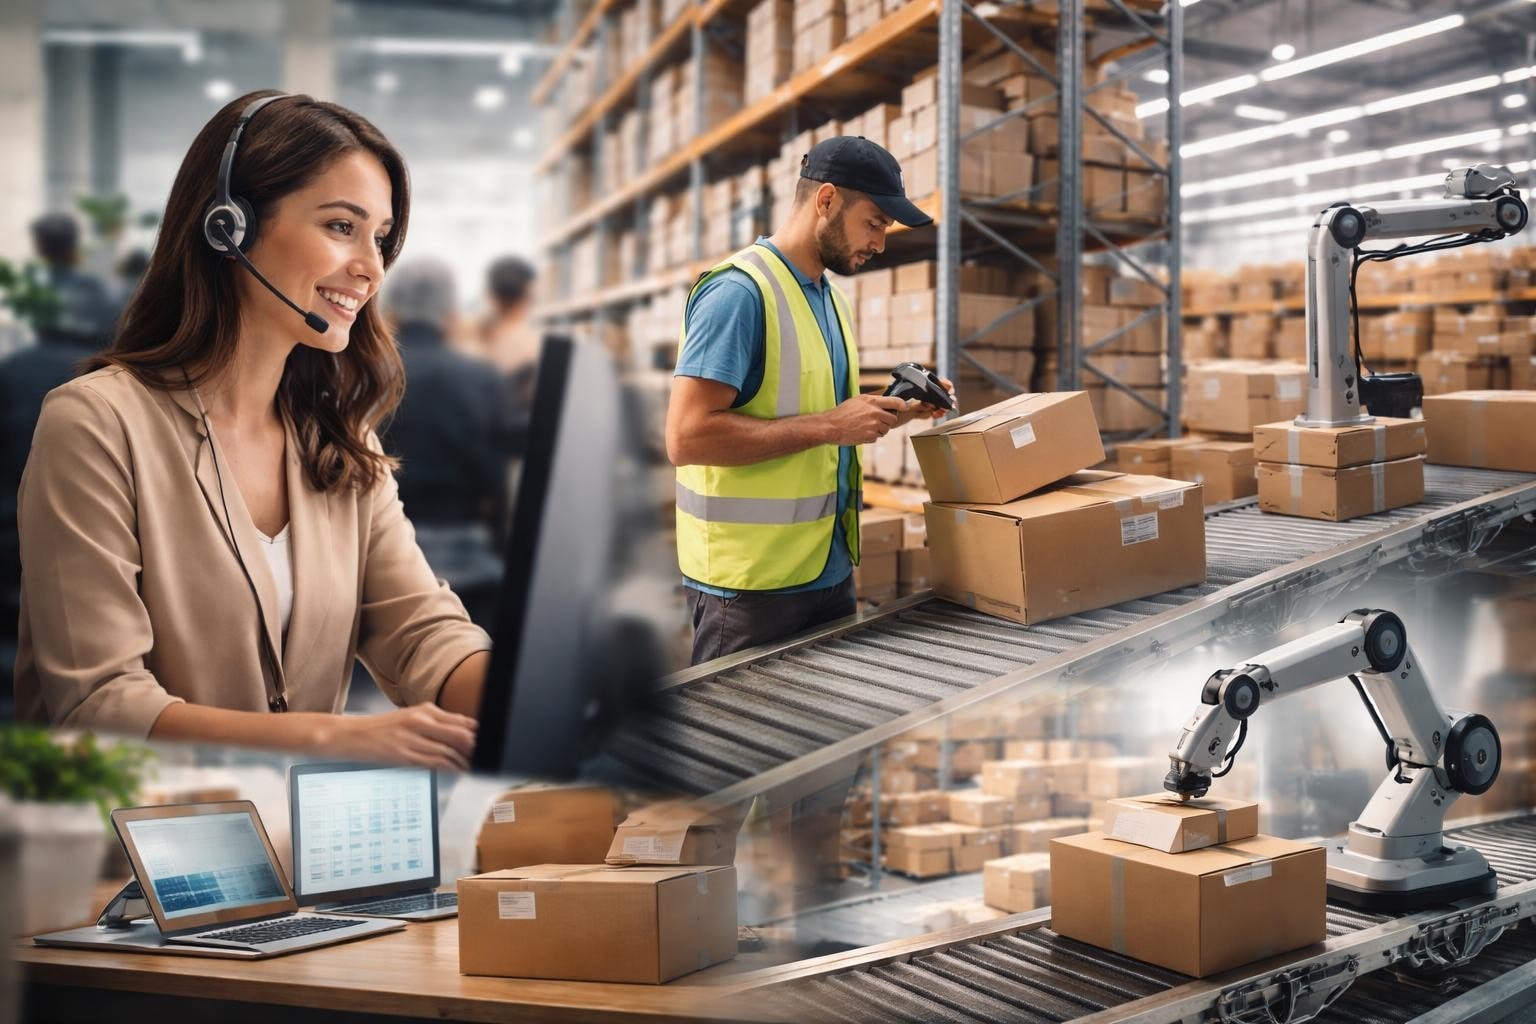
Automation Opportunities in Returns Processing
- Customer-initiated return portal integration with automated label generation
- Barcode scanning systems for rapid product identification and tracking
- Automated sorting equipment routing products to appropriate disposition areas
- Quality assessment automation using computer vision and sensors
- Inventory management integration for real-time stock level updates
Implementing these technologies requires upfront investment but delivers substantial long-term savings. Brands processing high return volumes should evaluate return on investment timelines, typically achieving breakeven within 18-24 months for comprehensive automation systems.
Sustainability and Circular Economy Principles
Environmental considerations increasingly influence reverse logistics e commerce strategies. Consumer awareness about waste and carbon footprints drives demand for sustainable returns management. Recent research presents circular reverse logistics frameworks that emphasize sustainability and efficient resource utilization throughout the returns process.
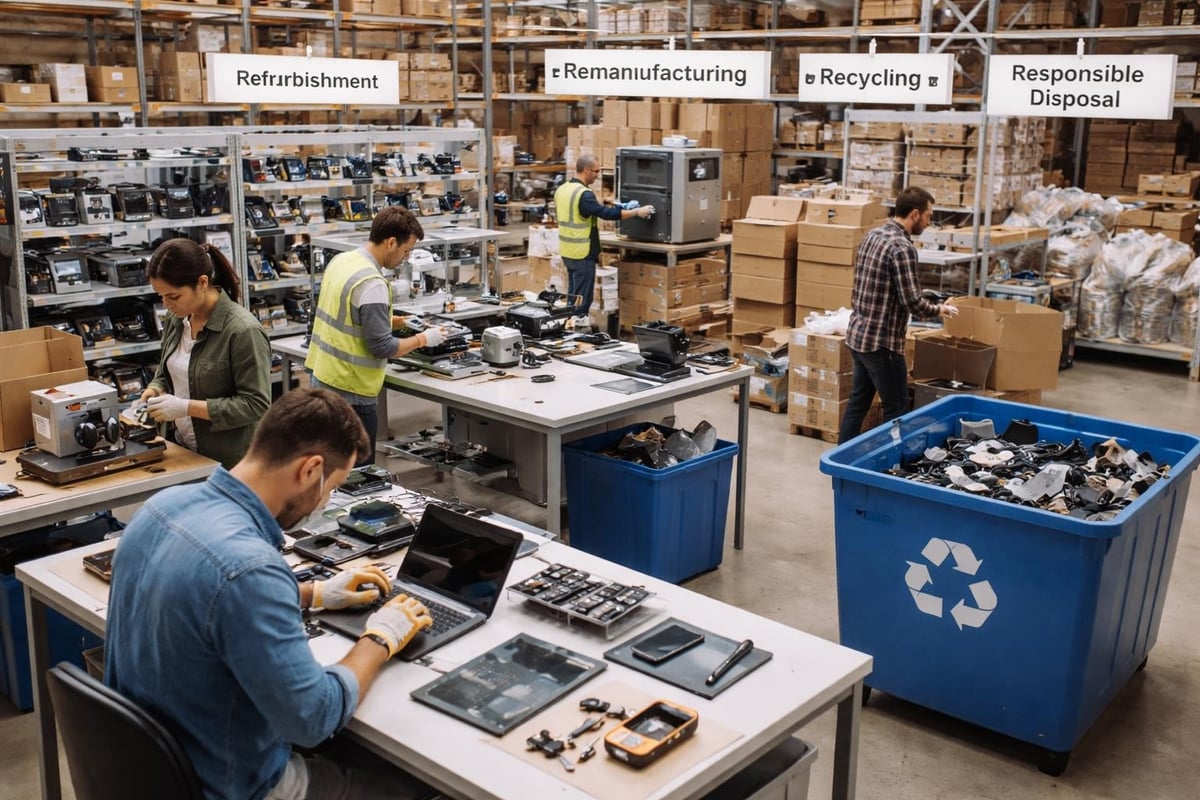
Product refurbishment extends lifecycle and reduces waste. Items returned in like-new condition receive minor reconditioning before returning to primary inventory. Products with cosmetic damage move to secondary markets through outlet channels or liquidation partners. Components from irreparable items feed recycling streams rather than landfills.
Transparent communication about sustainability initiatives builds brand loyalty. Customers appreciate knowing their returned items receive responsible handling. Some innovative brands offer incentives for customers choosing store credit over refunds, enabling more flexible disposition options that prioritize sustainability over immediate processing speed.
Environmental Benefits of Optimized Reverse Logistics
- Reduced landfill waste through strategic refurbishment programs
- Lower carbon emissions from consolidated return shipments
- Extended product lifecycles through repair and resale channels
- Recycled materials recovery for manufacturing inputs
- Decreased packaging waste through reusable return containers
Brands committed to environmental stewardship should seek fulfillment partners who share these values. Amazon FBA prep services that incorporate sustainability into operations align with modern consumer expectations while reducing environmental impact.
Returns Policy Optimization and Customer Experience
Strategic returns policies balance customer satisfaction against operational costs. Overly generous policies invite abuse and inflate costs, while restrictive policies damage customer relationships and reduce conversion rates. The optimal approach considers product category, customer lifetime value, and competitive positioning.
Free return shipping increases conversion rates by 15-20% but significantly impacts margins. Restocking fees deter fraudulent returns but frustrate legitimate customers. Return windows ranging from 30-90 days represent industry standards, with variations based on product type and seasonality. Testing different policy combinations through controlled experiments reveals optimal configurations for specific customer segments.
| Policy Element | Restrictive Approach | Balanced Approach | Generous Approach |
|---|---|---|---|
| Return Window | 14-30 days | 30-60 days | 60-90+ days |
| Return Shipping | Customer pays | Shared cost | Free returns |
| Restocking Fee | 15-20% | 5-10% selective | No fees |
| Refund Method | Store credit only | Credit or refund | Customer choice |
Data analytics reveal which policy elements most influence customer behavior. Sophisticated brands segment policies by customer tier, offering premium experiences to high-value customers while implementing standard policies for occasional shoppers. This segmentation approach maximizes customer lifetime value while controlling reverse logistics costs.
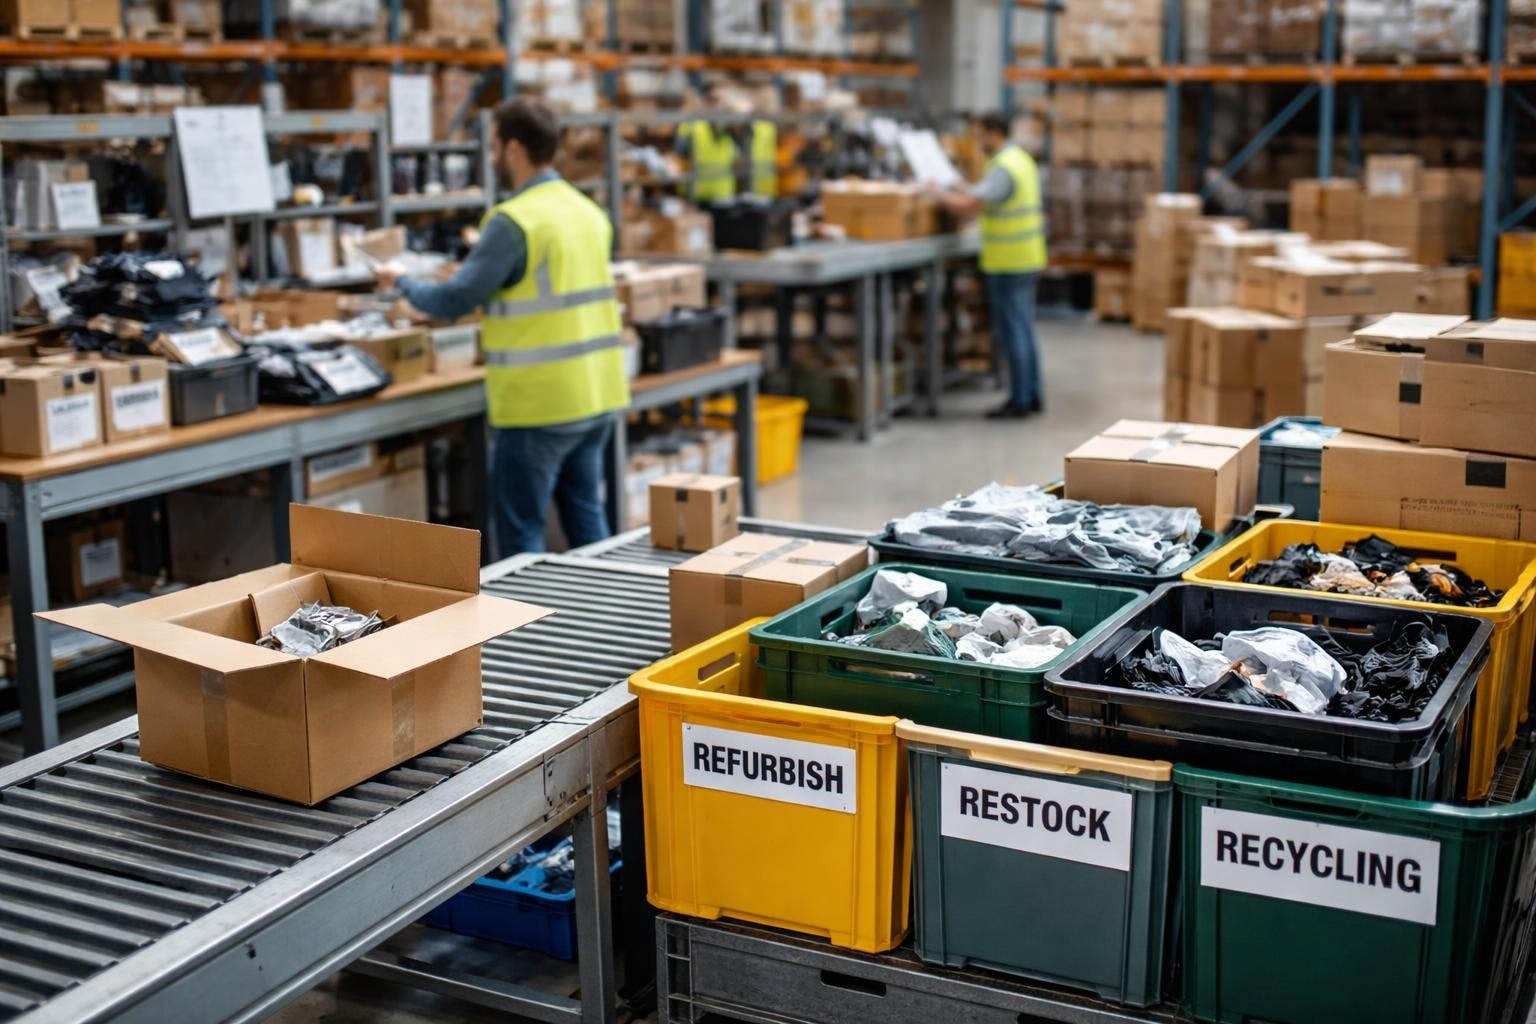
Quality Control and Inventory Disposition Strategies
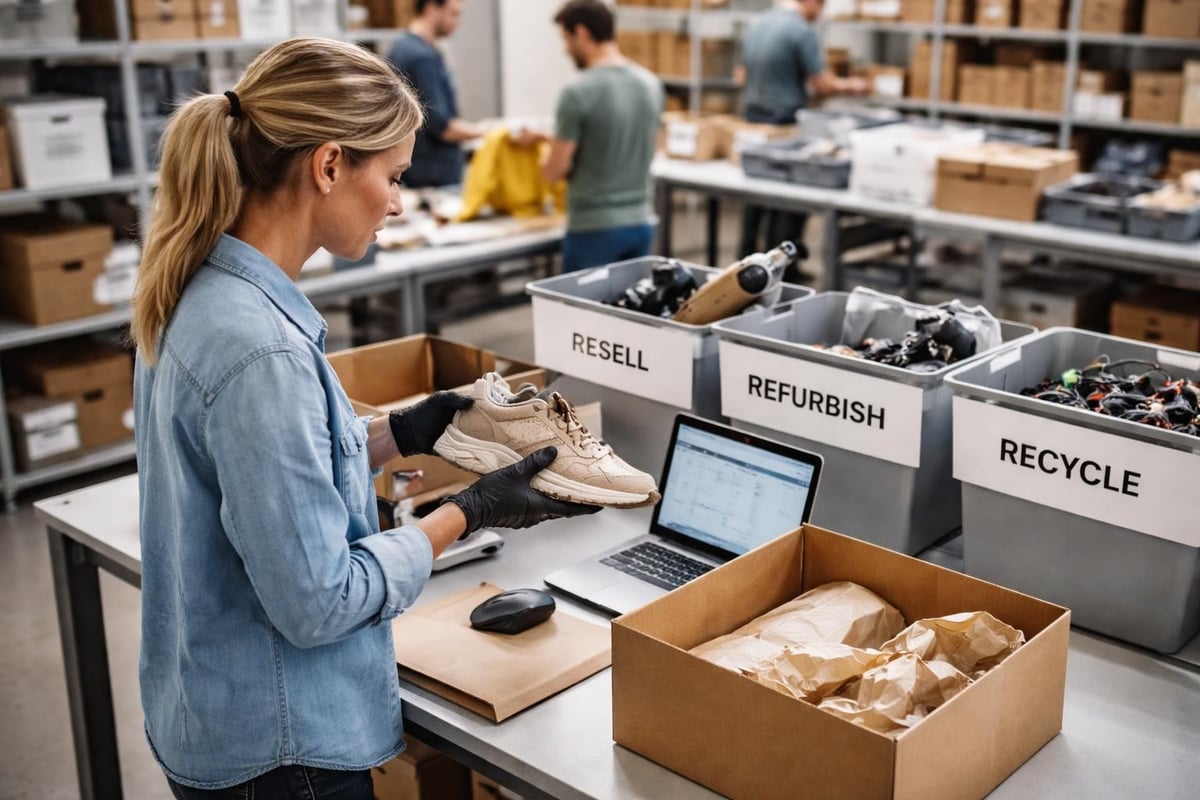
Efficient reverse logistics e commerce operations depend on rapid, accurate quality assessments. Products arriving at returns centers require systematic evaluation determining their next destination. Grade A returns in perfect condition return directly to sellable inventory. Grade B items with minor issues move to refurbishment. Grade C products containing functional defects flow to liquidation or recycling.
Standardized inspection protocols ensure consistency across team members and shifts. Detailed checklists covering packaging condition, product functionality, cosmetic appearance, and accessory completeness guide evaluators through systematic assessments. Digital documentation creates audit trails supporting financial reconciliation and fraud prevention.
Multi-Channel Disposition Framework
- Primary inventory: Pristine returns meeting new product standards
- Refurbishment queue: Minor cosmetic issues requiring light reconditioning
- Outlet channels: Functional products with packaging damage or cosmetic flaws
- Component harvesting: Products with salvageable parts for repairs or bundling
- Recycling partnerships: Materials recovery from irreparable items
- Responsible disposal: Final resort for items without recovery value
Kitting and bundling services enable creative solutions for imperfect returns. Products with damaged primary packaging can combine into value bundles or promotional sets, recovering value that would otherwise flow to liquidation channels. This approach demonstrates how integrated fulfillment capabilities enhance reverse logistics outcomes.
Vendor Management and Third-Party Partnerships
Many growing e-commerce brands lack the infrastructure for managing reverse logistics internally. Strategic partnerships with specialized fulfillment service providers offer scalability without capital investment in dedicated returns facilities. Selecting the right partner requires evaluating capabilities, technology integration, pricing models, and service level commitments.
Volume-based pricing structures typically offer better economics than per-unit fees for high-growth brands. Service level agreements should specify processing timeframes, quality standards, and reporting deliverables. Integration capabilities between partner systems and your e-commerce platform determine operational efficiency and data visibility.
Evaluate potential partners across multiple dimensions. Visit facilities to observe operations firsthand. Request references from brands with similar product categories and return volumes. Assess technology platforms for compatibility with your existing systems. Verify sustainability practices align with your brand values. Examine financial stability ensuring partnership longevity through your growth trajectory.
Vendor Evaluation Criteria Checklist
- Geographic coverage and facility locations
- Technology platform capabilities and integration options
- Pricing transparency and volume discount structures
- Specialty services for product categories (electronics testing, garment steaming)
- Quality control processes and accuracy guarantees
- Reporting dashboards and data access
- Sustainability practices and certifications
- References from comparable e-commerce brands
The design model for sustainable reverse logistics emphasizes integrating sustainability throughout returns management, a consideration particularly relevant when selecting fulfillment partners who align with long-term brand positioning.
Performance Metrics and Continuous Improvement
Measuring reverse logistics e commerce performance requires tracking both operational efficiency and customer satisfaction metrics. Processing cycle time measures speed from return receipt to disposition completion. Restocking percentage indicates what portion of returns reenters sellable inventory. Return fraud rate monitors policy abuse requiring intervention.
Customer-facing metrics include return authorization speed, refund processing time, and customer satisfaction scores for the returns experience. Balancing operational efficiency with customer experience prevents optimizing one dimension while degrading the other. Monthly scorecards tracking these metrics against targets drive continuous improvement initiatives.
Advanced analytics identify root causes behind return patterns. If specific products experience disproportionate return rates, investigation might reveal sizing inconsistencies, misleading product descriptions, or quality defects requiring supplier conversations. Geographic return pattern analysis might uncover shipping damage issues on particular routes, prompting packaging improvements.
Essential Reverse Logistics KPIs
| Metric Category | Key Performance Indicator | Industry Benchmark |
|---|---|---|
| Efficiency | Average processing time | 3-5 business days |
| Quality | Restocking accuracy rate | 95%+ |
| Financial | Cost per return processed | $8-15 (category dependent) |
| Customer | Return experience NPS | 40-60 |
| Fraud | Policy abuse detection rate | 2-5% of returns |
Regular performance reviews identify improvement opportunities. Quarterly business reviews with fulfillment partners ensure accountability and collaborative problem-solving. Benchmarking against industry standards reveals competitive positioning and highlights areas requiring investment or process redesign.
Strategic Returns Prevention Initiatives
While efficient reverse logistics processes minimize costs once returns occur, preventing unnecessary returns delivers even greater value. Product description accuracy reduces expectation mismatches. Size guides and fit tools decrease apparel returns. Unboxing videos and 360-degree photography set appropriate expectations reducing buyer's remorse.
Customer feedback analysis reveals patterns in return reasons. If sizing issues dominate apparel returns, enhanced measurement guides or virtual fitting technology might address root causes. Electronics returns driven by perceived complexity suggest improved quick-start guides or video tutorials. Addressing these issues proactively reduces reverse logistics volume more effectively than process optimization alone.
Quality control improvements during fulfillment operations catch defects before shipping. Pre-shipment inspection protocols verify product condition, complete accessory sets, and proper packaging. This investment in quality control delivers returns on investment through reduced return rates and enhanced customer satisfaction.
Mastering reverse logistics e commerce operations transforms a necessary cost center into a competitive advantage that enhances customer loyalty while protecting profit margins. As return volumes continue growing alongside e-commerce expansion, strategic investments in technology, partnerships, and sustainable practices position forward-thinking brands for long-term success. Ecom Automation Prep delivers comprehensive fulfillment solutions including specialized reverse logistics services designed to streamline returns processing, maximize inventory recovery, and support sustainable growth for fast-scaling e-commerce brands.